Task
Scatter Plot Quest A

Research and record the average life span of an American for each decade going back as far as you can find and ending with 2010. Make a scatter plot using the information that you have found. Your independent variable is the time in history and the dependent variable is the average age. Include all URL’s from which you gain your information.
Proceed to Process
Scatter Plot Quest B

Research and record the minimum salary of a major league baseball player going back as far as you can find and ending with 2010. Make a scatter plot using the information that you have found. Your independent variable is the time in history and the dependent variable is the minimum salary. Include all URL’s from which you gain your information.
Proceed to Process
Scatter Plot Quest C

Research and record the average price of gold per year going back to 1900 and ending with 2010. Make a scatter plot using the information that you have found. Your independent variable is the time in history and the dependent variable is the average price of gold. Include all URL’s from which you gain your information.
Proceed to Process
Scatter Plot Quest D
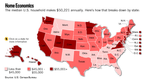
Research and record the average yearly income of an American going back as far as you can find and ending with 2010. Make a scatter plot using the information that you have found. Your independent variable is the time in history and the dependent variable is the average American income. Include all URL’s from which you gain your information.
Proceed to Process
Proceed to Process
Scatter Plot Quest E

Research and record the historical minimum wages for American workers going back as far as you can find and ending with 2010. Make a scatter plot using the information that you have found. Your independent variable is the time in history and the dependent variable is the minimum wage. Include all URL’s from which you gain your information.
Proceed to Process
| scatterplotproject |
